01
⚡
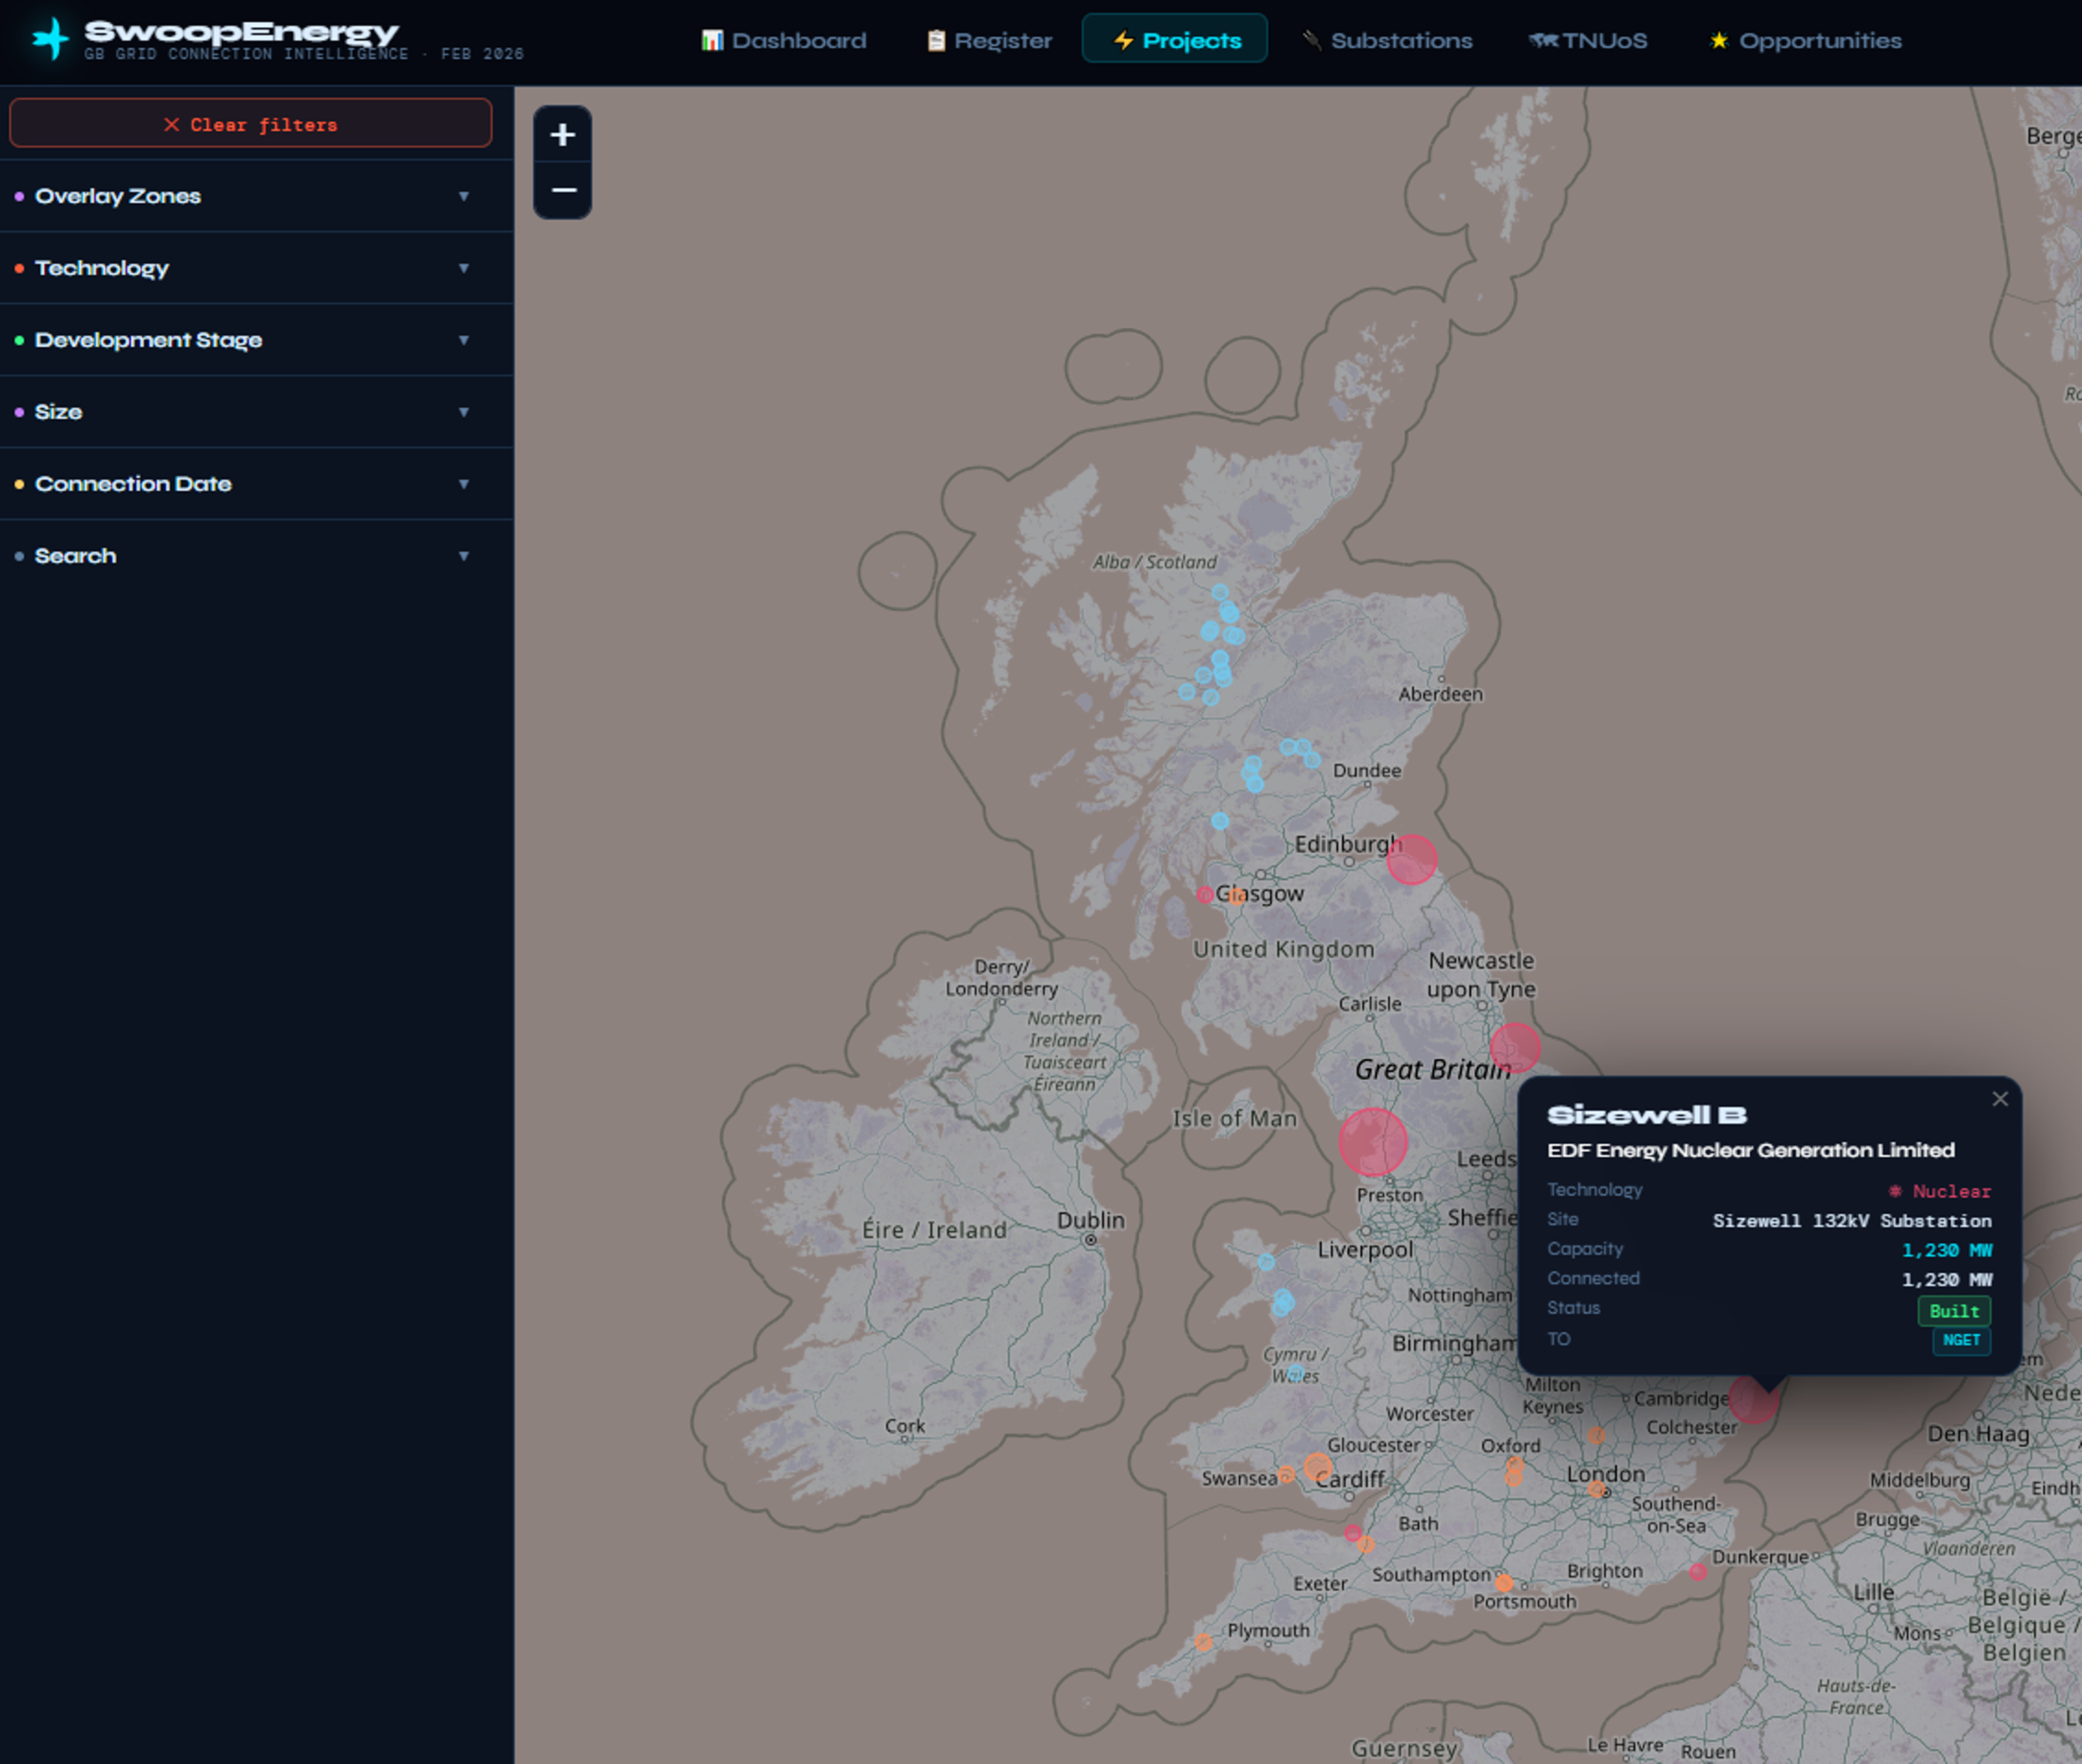
Projects Map
Every TEC Register project plotted on an interactive GB map. Filter by technology, development stage, MW capacity and connection date simultaneously. Click any marker for full project details — capacity, developer, connection stage and effective date.
22 Technology Types
02
🔌
Substation Intelligence
Switch to a substation-centric view of the GB network. Click any connection point to see every project connected to that node — total capacity, built vs. pipeline split, and developer mix. Filter by voltage level from 400kV down to 33kV.
1,161 Connection Points
03
🗺
TNUoS Tariff Map
A dedicated analytical module for transmission cost exposure. Visualise all 27 NESO generation zones across multiple tariff years, switch between generator types — Intermittent, Baseload and Pumped Storage — and toggle between £/kW and £/MWh views.
27 Zones · Multi-Year
04
✨
Opportunities
Grid-connected assets seeking investment or available for acquisition — with full grid connection context built in. Solar, wind, BESS and hybrid projects listed with their Gate stage, connection site and revenue model. For Sale, Equity Stake and Debt Finance.
Asset Marketplace